
This is the 9th article of the Makuake Advent Calendar 2022!
Improving Code Performance with Go
When I thought about improving the performance of my custom HTTP Router, goblin, I tackled performance improvements in Go, and I will write about the approaches and practices I implemented during that time.
Prerequisite Knowledge
I believe that deeper tuning requires more knowledge, but I will list only the minimum necessary information.
- Garbage Collection
- A feature that automatically frees up memory areas that are no longer needed from the memory space allocated by the program during execution.
- Memory Areas
- Text Area
- The area where the program converted to machine language is allowed.
- Stack Area
- The memory area allocated during program execution.
- It targets data whose size is determined at runtime.
- Automatically freed (when the function execution ends and it is no longer needed).
- e.g., arguments, return values, temporary variables, etc.
- Heap Area
- The memory area allocated during program execution.
- It targets data whose size is determined dynamically.
- Subject to garbage collection.
- Static Area
- The memory area allocated during program execution.
- Allocated until the program ends.
- e.g., global variables and static variables.
- Text Area
Approach to Performance Improvement
There is a premise that there is a necessity to improve performance (whether it is worth sacrificing readability, whether it can be definitively stated that the application is a bottleneck, etc.), but I will proceed with the discussion based on the assumption that there is a necessity.
As methods to improve code performance, several ideas come to mind, such as:
- Algorithm optimization
- Data structure optimization
- Utilizing caches
- Applying parallel processing
- Compilation optimization
However, before implementing any improvements, measurements and analyses should be conducted. (I will not touch on the necessity of performance improvement as it varies by individual needs.)
I will introduce packages and tools for measurement and analysis in Go.
Benchmark
In Go, benchmarks for obtaining code performance are included in the standard package testing as Benchmarks.
For example, executing the following code with the command go test -bench=. -benchmem will obtain benchmarks.
package main

import (
	"math/rand"
	"testing"
)

func BenchmarkRandIn(b *testing.B) {
	for i := 0; i < b.N; i++ { // b.N automatically specifies the number of times the benchmark should run to be reliable
		rand.Int() // The function to be measured
	}
}
The output will look like this:
goos: darwin
goarch: amd64
pkg: bmf-san/go-perfomance-tips
cpu: VirtualApple @ 2.50GHz
BenchmarkRandIn-8       87550500                13.53 ns/op            0 B/op          0 allocs/op
PASS
ok      bmf-san/go-perfomance-tips      1.381s
From the benchmark results, we can read the following:
- 87550500
- The number of times the function was executed.
- The more times it is executed, the better the performance is considered.
- 13.53 ns/op
- The time taken for one execution of the function.
- The less time taken, the better the performance is considered.
- 0 B/op
- The size of memory allocated for each execution of the function.
- The less allocated, the better the performance is considered.
- 0 allocs/op
- The number of memory allocations made during one execution of the function.
- The fewer allocations, the better the performance is considered.
Go makes it easy to obtain benchmarks in this way.
For more information on other Go benchmark features, refer to the documentation. Benchmarks
As a tool to compare benchmark results, the package benchstat can be used, which displays the percentage of improvement in benchmark results.
In my managed repository, bmf-san/goblin, I have integrated it into CI to compare results before and after commits.
// This is an example where nothing has improved...
go test -bench . -benchmem -count 1 > new.out
benchstat old.out new.out
name           old time/op    new time/op    delta
Static1-36        248ns ± 0%     246ns ± 0%   ~     (p=1.000 n=1+1)
Static5-36        502ns ± 0%     495ns ± 0%   ~     (p=1.000 n=1+1)
Static10-36       874ns ± 0%     881ns ± 0%   ~     (p=1.000 n=1+1)
WildCard1-36     1.60µs ± 0%    1.50µs ± 0%   ~     (p=1.000 n=1+1)
WildCard5-36     4.49µs ± 0%    4.92µs ± 0%   ~     (p=1.000 n=1+1)
WildCard10-36    7.68µs ± 0%    7.58µs ± 0%   ~     (p=1.000 n=1+1)
Regexp1-36       1.38µs ± 0%    1.48µs ± 0%   ~     (p=1.000 n=1+1)
Regexp5-36       4.30µs ± 0%    4.11µs ± 0%   ~     (p=1.000 n=1+1)
Regexp10-36      7.66µs ± 0%    7.18µs ± 0%   ~     (p=1.000 n=1+1)
If you absolutely cannot allow performance degradation, it might be a good idea to implement a mechanism that fails the CI.
If you want to see the actual memory allocation situation after looking at such benchmark results, you can confirm it by building with specified build options.
By increasing the number of -m specified in -gcflags, you can obtain more detailed results.
package main

import "fmt"

// Run build with go build -o example -gcflags '-m' gcflagsexample.go
func main() {
	a := "hello"
	b := "world"
	fmt.Println(a + b)
}
When you execute go build -o example -gcflags '-m' gcflagsexample.go, you will get the following output.
# command-line-arguments
./gcflagsexample.go:9:13: inlining call to fmt.Println
./gcflagsexample.go:9:13: ... argument does not escape
./gcflagsexample.go:9:16: a + b escapes to heap
./gcflagsexample.go:9:16: a + b escapes to heap
This is a simple example, so it is obvious at a glance, but by identifying allocations to the heap in this way and reducing heap allocations, you can improve memory allocation, making it a useful method for analysis.
Profiling
Go has a tool called pprof for analyzing where the bottlenecks are at the function level.
package main

import (
	"sort"
	"testing"
)

func sortAlphabetically() {
	s := []string{"abc", "aba", "cba", "acb"}
	sort.Strings(s)
}

func BenchmarkSortAlphabetically(b *testing.B) {
	for i := 0; i < b.N; i++ {
		sortAlphabetically()
	}
}
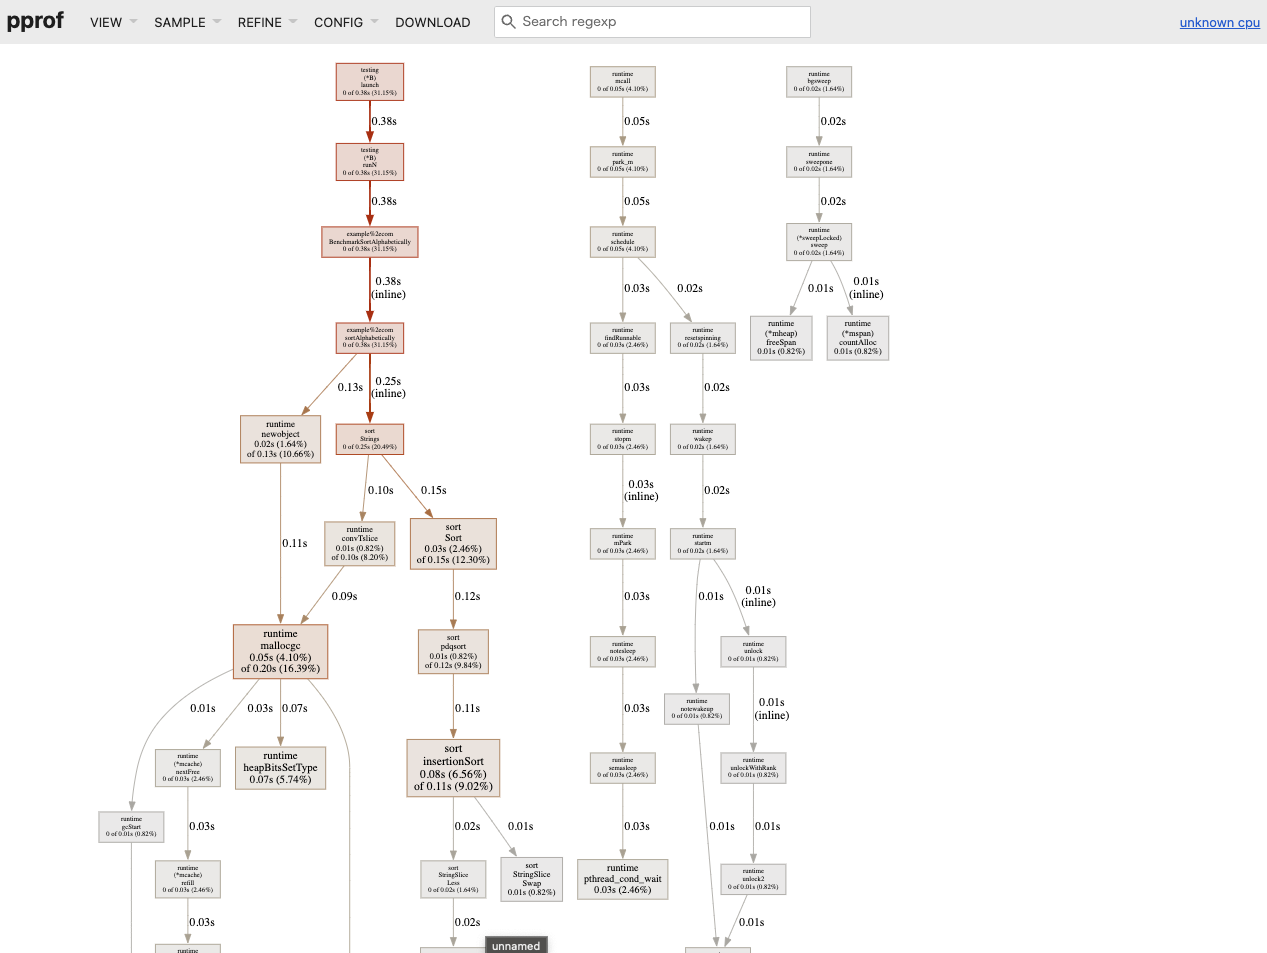
To see the CPU profile, execute the following:
go test -test.bench=BenchmarkSortAlphabetically -cpuprofile cpu.out && go tool pprof -http=":8888" cpu.out
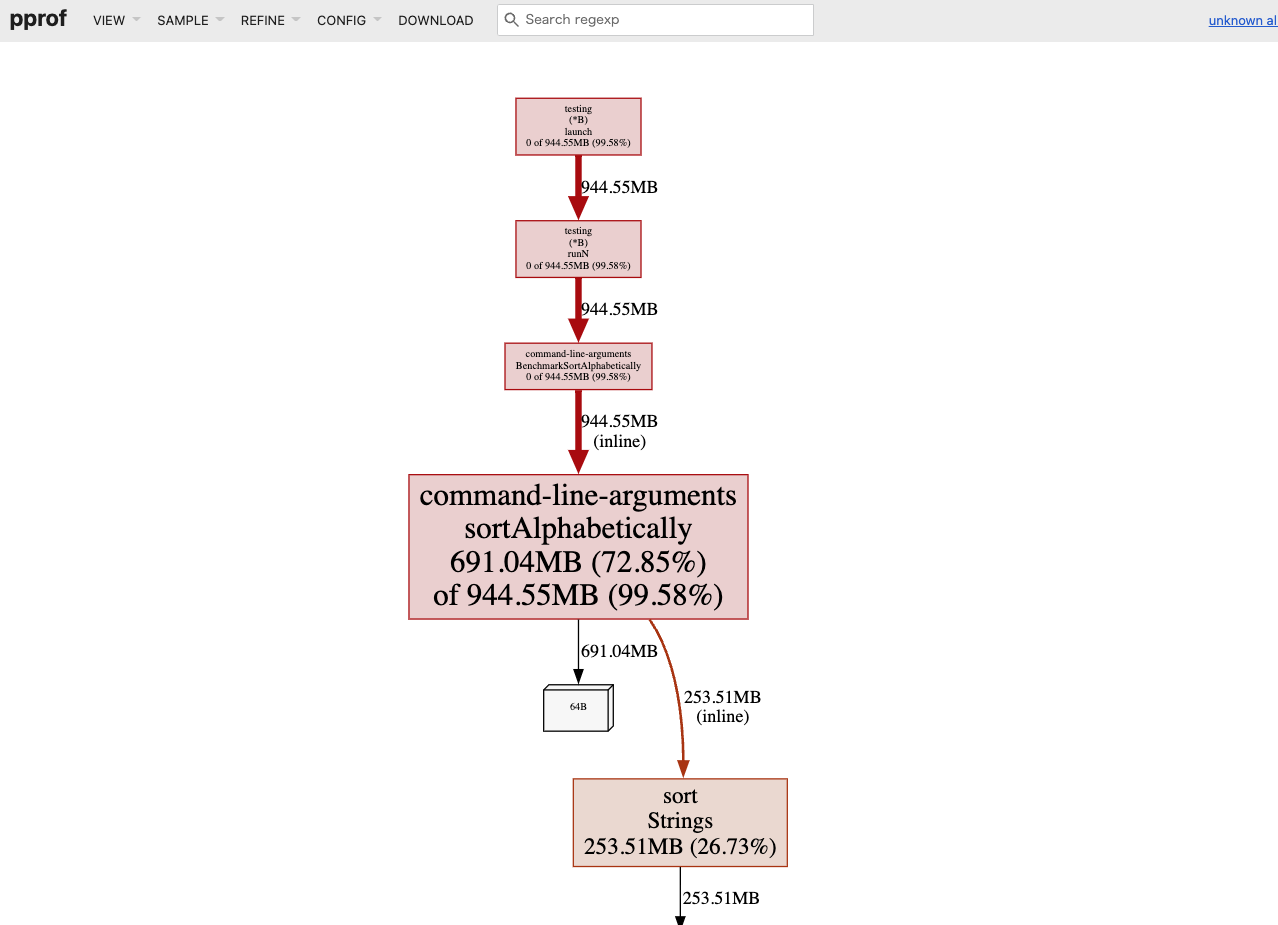
To see the memory profile, execute the following:
go test -test.bench=BenchmarkSortAlphabetically profilingexample_test.go -memprofile mem.out && go tool pprof -http=":8889" mem.out
By utilizing the UI of pprof, it becomes easier to identify where the bottlenecks are in the processing.
Practice
I will provide an example of improvements made to my custom HTTP Router, goblin.
The PR in question is here. Reduce the memory allocation by refactoring explodePath method #68
goblin is an HTTP Router that works well with the net/http interface based on a trie.
It has the minimum features that are thought necessary for routing. cf. goblin#features
Benchmark
First, I will run benchmark tests to measure performance.
go test -bench=. -cpu=1 -benchmem
The benchmark tests have prepared about three test cases each for static routing (e.g., /foo/bar), dynamic routing (e.g., /foo/:bar), and routing using regular expressions (e.g., /foo/:bar[^\d+$]).
The flow of routing processing is as follows:
- Insert data into the tree structure (≒ define routing)
- Search for data from the tree structure (return data based on the requested path)
However, this test case is set to measure only the latter.
The output results are as follows.
goos: darwin
goarch: amd64
pkg: github.com/bmf-san/goblin
cpu: VirtualApple @ 2.50GHz
BenchmarkStatic1         5072353               240.1 ns/op           128 B/op          4 allocs/op
BenchmarkStatic5         2491546               490.0 ns/op           384 B/op          6 allocs/op
BenchmarkStatic10        1653658               729.6 ns/op           720 B/op          7 allocs/op
BenchmarkWildCard1       1602606               747.3 ns/op           456 B/op          9 allocs/op
BenchmarkWildCard5        435784              2716 ns/op            1016 B/op         23 allocs/op
BenchmarkWildCard10       246729              5033 ns/op            1680 B/op         35 allocs/op
BenchmarkRegexp1         1647258               733.2 ns/op           456 B/op          9 allocs/op
BenchmarkRegexp5          456652              2641 ns/op            1016 B/op         23 allocs/op
BenchmarkRegexp10         251998              4780 ns/op            1680 B/op         35 allocs/op
PASS
ok      github.com/bmf-san/goblin       14.304s
Trends can be observed in the number of executions, time per execution, memory size per execution, and the number of memory allocations.
I personally find it concerning that memory allocations occur even with static routing. (Looking at benchmarks of other HTTP Routers, some show 0 allocs.)
Profiling
Next, I will use pprof to obtain profiles.
This time, I will focus only on memory to obtain the profile.
go test -bench . -memprofile mem.out && go tool pprof -http=":8889" mem.out
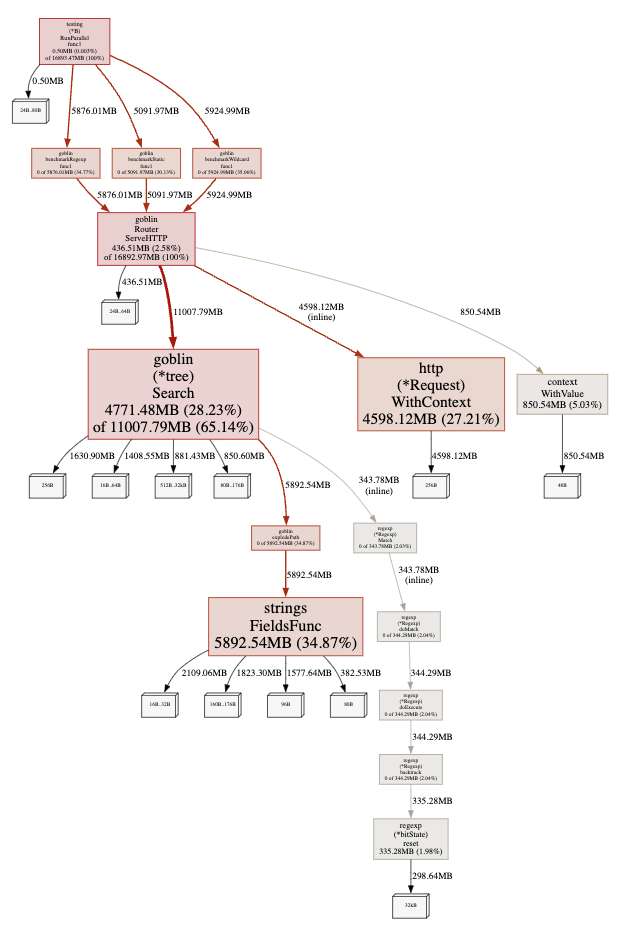
Graph output results.
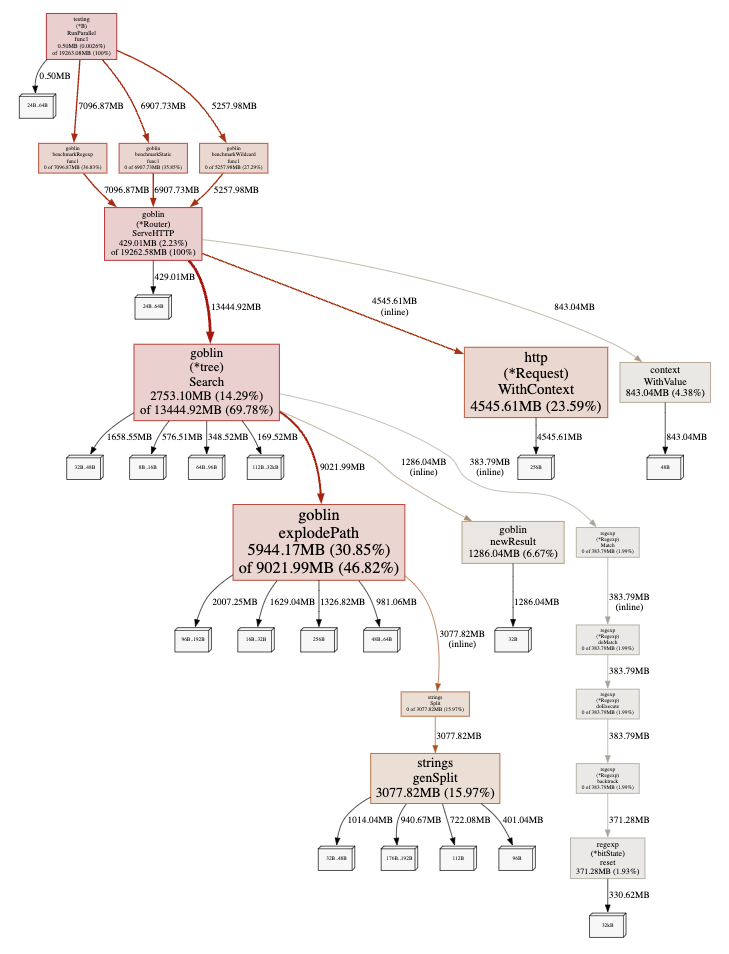
It is clear that the process consuming the most memory is explodePath.
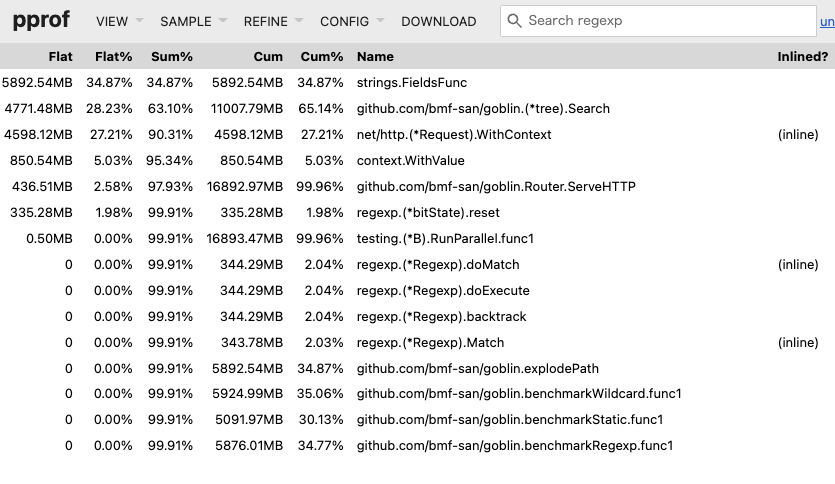
Looking at the Top (a list sorted by execution time), explodePath is at the top.
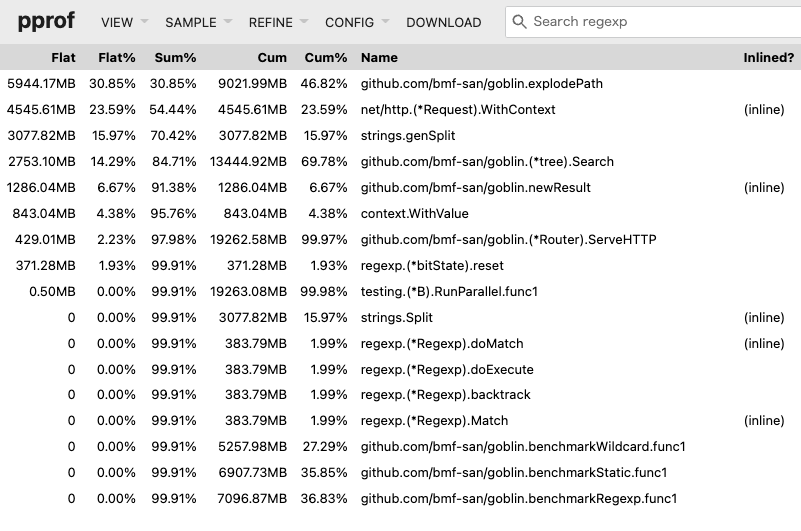
Flat shows the processing time of the function, while Cum includes the processing time along with waiting time.
Furthermore, I will check which part of the processing within the function is heavy using Source.
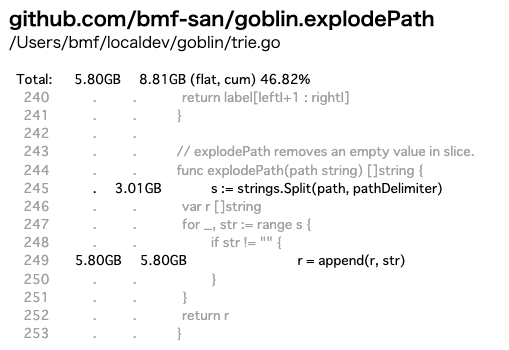
Since Search is the core processing responsible for the router's matching, I suspected that it would be the biggest bottleneck, and it turned out that a specific processing within it, explodePath, was the bottleneck.
Tuning
explodePath is a process that splits the received string by / and returns it as a []string type.
// explodePath removes an empty value in slice.
func explodePath(path string) []string {
	s := strings.Split(path, pathDelimiter)
	var r []string
	for _, str := range s {
		if str != "" {
			r = append(r, str)
		}
	}
	return r
}
For clarity, I also included test code.
func TestExplodePath(t *testing.T) {
	cases := []struct {
		actual   []string
		expected []string
	}{
		{
			actual:   explodePath(""),
			expected: nil,
		},
		{
			actual:   explodePath("/"),
			expected: nil,
		},
		{
			actual:   explodePath("//"),
			expected: nil,
		},
		{
			actual:   explodePath("///"),
			expected: nil,
		},
		{
			actual:   explodePath("/foo"),
			expected: []string{"foo"},
		},
		{
			actual:   explodePath("/foo/bar"),
			expected: []string{"foo", "bar"},
		},
		{
			actual:   explodePath("/foo/bar/baz"),
			expected: []string{"foo", "bar", "baz"},
		},
		{
			actual:   explodePath("/foo/bar/baz/"),
			expected: []string{"foo", "bar", "baz"},
		},
	}

	for _, c := range cases {
		if !reflect.DeepEqual(c.actual, c.expected) {
			t.Errorf("actual:%v expected:%v", c.actual, c.expected)
		}
	}
}
The variable r defined as []string does not have a specified capacity, so it is presumed to be inefficient in terms of memory.
Below is a benchmark test prepared to verify the effect of adding append to a slice and its results.
package main

import "testing"

func BenchmarkSliceLen0Cap0(b *testing.B) {
	var s []int

	b.StartTimer()
	for i := 0; i < b.N; i++ {
		s = append(s, i)
	}
	b.StopTimer()
}

func BenchmarkSliceLenN(b *testing.B) {
	var s = make([]int, b.N)

	b.StartTimer()
	for i := 0; i < b.N; i++ {
		s = append(s, i)
	}
	b.StopTimer()
}

func BenchmarkSliceLen0CapN(b *testing.B) {
	var s = make([]int, 0, b.N)

	b.StartTimer()
	for i := 0; i < b.N; i++ {
		s = append(s, i)
	}
	b.StopTimer()
}
goos: darwin
goarch: amd64
pkg: example.com
cpu: VirtualApple @ 2.50GHz
BenchmarkSliceLen0Cap0  100000000               11.88 ns/op           45 B/op          0 allocs/op
BenchmarkSliceLenN      78467056                23.60 ns/op           65 B/op          0 allocs/op
BenchmarkSliceLen0CapN  616491007                5.057 ns/op           8 B/op          0 allocs/op
PASS
ok      example.com     6.898s
From this result, it can be inferred that specifying the capacity will lead to more efficient code.
Therefore, I modified explodePath as follows.
func explodePath(path string) []string {
	s := strings.Split(path, "/")
	// var r []string
	r := make([]string, 0, strings.Count(path, "/")) // Specify capacity
	for _, str := range s {
		if str != "" {
			r = append(r, str)
		}
	}
	return r
}
Going a bit further, I improved the implementation.
func explodePath(path string) []string {
	splitFn := func(c rune) bool {
		return c == '/'
	}
	return strings.FieldsFunc(path, splitFn)
}
I will compare benchmarks of three patterns: the original explodePath, the implementation with specified slice capacity, and the implementation using strings.FieldsFunc.
package main

import (
	"strings"
	"testing"
)

func explodePath(path string) []string {
	s := strings.Split(path, "/")
	var r []string
	for _, str := range s {
		if str != "" {
			r = append(r, str)
		}
	}
	return r
}

func explodePathCap(path string) []string {
	s := strings.Split(path, "/")
	r := make([]string, 0, strings.Count(path, "/"))
	for _, str := range s {
		if str != "" {
			r = append(r, str)
		}
	}
	return r
}

func explodePathFieldsFunc(path string) []string {
	splitFn := func(c rune) bool {
		return c == '/'
	}
	return strings.FieldsFunc(path, splitFn)
}

func BenchmarkExplodePath(b *testing.B) {
	paths := []string{"", "/", "///", "/foo", "/foo/bar", "/foo/bar/baz"}
	b.StartTimer()
	for i := 0; i < b.N; i++ {
		for _, v := range paths {
			explodePath(v)
		}
	}
	b.StopTimer()
}

func BenchmarkExplodePathCap(b *testing.B) {
	paths := []string{"", "/", "///", "/foo", "/foo/bar", "/foo/bar/baz"}
	b.StartTimer()
	for i := 0; i < b.N; i++ {
		for _, v := range paths {
			explodePathCap(v)
		}
	}
	b.StopTimer()
}

func BenchmarkExplodePathFieldsFunc(b *testing.B) {
	paths := []string{"", "/", "///", "/foo", "/foo/bar", "/foo/bar/baz"}
	b.StartTimer()
	for i := 0; i < b.N; i++ {
		for _, v := range paths {
			explodePathFieldsFunc(v)
		}
	}
	b.StopTimer()
}
goos: darwin
goarch: amd64
pkg: example.com
cpu: VirtualApple @ 2.50GHz
BenchmarkExplodePath             1690340               722.2 ns/op           432 B/op         12 allocs/op
BenchmarkExplodePathCap          1622161               729.5 ns/op           416 B/op         11 allocs/op
BenchmarkExplodePathFieldsFunc   4948364               239.5 ns/op            96 B/op          3 allocs/op
PASS
ok      example.com     5.685s
The implementation using strings.FieldsFunc seems to have the best performance, so I will adopt it.
Effect Measurement
Let’s check the results after improving the implementation of explodePath.
Benchmark
# Before Improvement
goos: darwin
goarch: amd64
pkg: github.com/bmf-san/goblin
cpu: VirtualApple @ 2.50GHz
BenchmarkStatic1         5072353               240.1 ns/op           128 B/op          4 allocs/op
BenchmarkStatic5         2491546               490.0 ns/op           384 B/op          6 allocs/op
BenchmarkStatic10        1653658               729.6 ns/op           720 B/op          7 allocs/op
BenchmarkWildCard1       1602606               747.3 ns/op           456 B/op          9 allocs/op
BenchmarkWildCard5        435784              2716 ns/op            1016 B/op         23 allocs/op
BenchmarkWildCard10       246729              5033 ns/op            1680 B/op         35 allocs/op
BenchmarkRegexp1         1647258               733.2 ns/op           456 B/op          9 allocs/op
BenchmarkRegexp5          456652              2641 ns/op            1016 B/op         23 allocs/op
BenchmarkRegexp10         251998              4780 ns/op            1680 B/op         35 allocs/op
PASS
ok      github.com/bmf-san/goblin       14.304s

# After Improvement
go test -bench=. -cpu=1 -benchmem -count=1
goos: darwin
goarch: amd64
pkg: github.com/bmf-san/goblin
cpu: VirtualApple @ 2.50GHz
BenchmarkStatic1        10310658               117.7 ns/op            32 B/op          1 allocs/op
BenchmarkStatic5         4774347               258.1 ns/op            96 B/op          1 allocs/op
BenchmarkStatic10        2816960               435.8 ns/op           176 B/op          1 allocs/op
BenchmarkWildCard1       1867770               653.4 ns/op           384 B/op          6 allocs/op
BenchmarkWildCard5        496778              2484 ns/op             928 B/op         13 allocs/op
BenchmarkWildCard10       258508              4538 ns/op            1560 B/op         19 allocs/op
BenchmarkRegexp1         1978704               608.4 ns/op           384 B/op          6 allocs/op
BenchmarkRegexp5          519240              2394 ns/op             928 B/op         13 allocs/op
BenchmarkRegexp10         280741              4309 ns/op            1560 B/op         19 allocs/op
PASS
ok      github.com/bmf-san/goblin       13.666s
Comparing before and after improvements, it seems that there is an overall trend of improvement.
Profiling
pprof Graph.
pprof Top.
It can be seen that the bottleneck has moved to strings.FieldsFunc called within explodePath.
Further Improvements
Other improvements have been made to goblin, and the released tag is here. 6.0.0
Since there have not been significant improvements in data structures or algorithms, it is somewhat of a minor improvement, and unfortunately, there are no remarkable results.
I feel that it is indeed difficult with the current data structures and algorithms being adopted. (Looking at other routers, they seem to adopt more advanced trees, so that makes sense...)
While it deviates slightly from the main topic, I created a benchmarker to see if I could gain insights for improvements by comparing with other routers.
It is interesting to compare, and it becomes clear that I am losing badly. I cried.
I want to study the implementations of other routers and improve my understanding of advanced tree structures, which I previously struggled with.
Summary
- Benchmarking and profiling are easy to do in Go.
- Do not guess; measure.
- Minor improvements are unlikely to yield significant results (which is true).
References
- github.com - google/pprof
- github.com - dgryski/go-perfbook
- dave.cheney.net - High Performance Go Workshop
- go.dev - Profiling Go Programs
- go.dev - A Guide to the Go Garbage Collector
- developer.so-tech.co.jp
- segment.com - Allocation efficiency in high-performance Go services
- blog.logrocket.com - Benchmarking in Golang: Improving function performance
- medium.com - Go code refactoring : the 23x performance hunt
- medium.com - Introducing the incredibly convenient web UI of the Go profiling tool, pprof
- teivah.medium.com - Good Code vs Bad Code in Golang
- hnakamur.github.io - How to check if your Go code results in heap allocation
- glog.kazu69.net - Observing Memory Management in Go
- dsas.blog.klab.org - How to write code in Go that pays attention to allocations
- tech.speee.jp - Zero Allocation from the Perspective of Go Logging Libraries
- kawasin73.hatenablog.com - Guilt over Memory Allocation